Open Policy Analysis for:
California Proposition 40, Analysis From Boll, Saez, Zucman (BSZ)
1 The main estimate is not the authors' choice: BSZ's headline is the wealth tax alone, about $100 billion in the abstract and $104 billion in Table 5, reproduced here as $103.8 billion. This OPA uses the total because it compares more directly with the JR analysis's net present value; the comparison overview puts both on one definition.
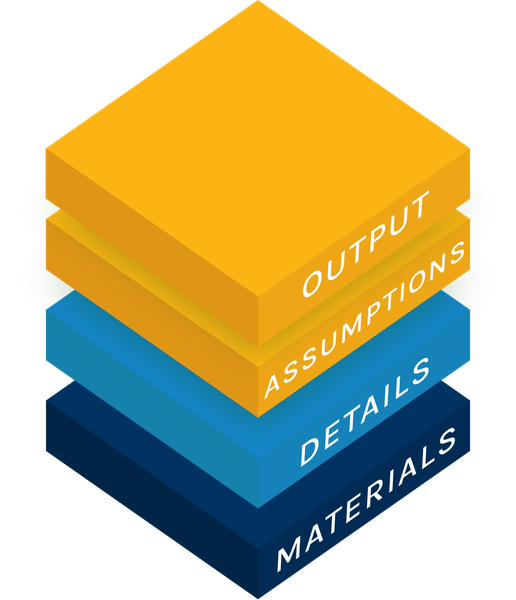
Three layers to understand the analysis
Explore the main estimate and its assumptions →
The one-time revenue, the extra income tax from asset sales and the yearly income tax lost to leavers, for every combination of six inputs: the four rows of the paper's Table 5 plus 1,916 settings the authors did not publish. The main estimate is marked.
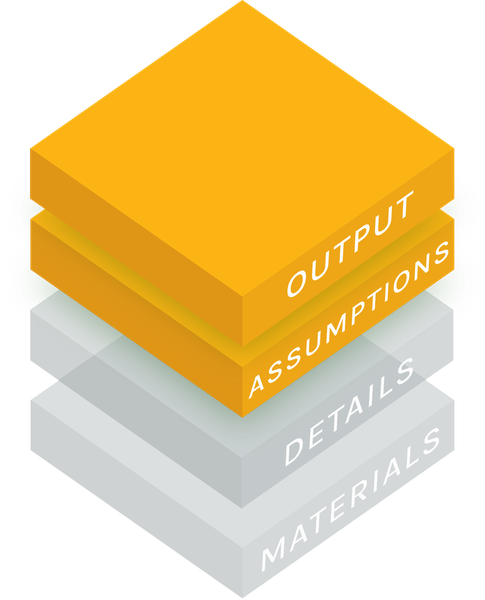
One reproduction, told two ways. Both read the same pipeline outputs.
The reproduction report →
The paper's tables and figures in its own order, rebuilt from the authors' workbook, with Table 5 derived step by step and every input sorted by origin.
Slides →
A short deck, best on a laptop: how a one-time tax gets estimated at $104 billion, and which parts of that are guesswork.

Materials for computational reproduction →
The R pipeline (built with {targets}, the R package that runs the pipeline's steps in order and records which outputs are current), the SQL and Python reproduction from the authors' raw data, the test
suite, every exported CSV and the source manifest with checksums. A guided summary is on the
materials page, linked in the text below.

What the model says
This OPA's main estimate is the base scenario of Table 5 in Boll, Saez and Zucman (2026), net of its income tax effects. The wealth tax is 5% of the $2,307 billion that Forbes lists for 250 California billionaires on 1 July 2026, less 10% for avoidance and evasion: $103.8 billion, collected once (the paper prints $104 billion; the abstract says about $100 billion). Selling assets to pay it adds $3.68B of income tax. Leavers take $0.15B a year with them, worth $0.70B over 5 years at 3%. The total is $106.8 billion.1 The other rows are the authors' own sensitivity checks.
| Scenario (Table 5 row) | Wealth tax, one time | Extra income tax from sales | Income tax lost, per year | Total (main estimate)2 |
|---|---|---|---|---|
| Base (1) | $103.8B | $3.7B | $0.15B | $106.8B |
| Missing billionaires (2) | $127.9B | $4.5B | $0.20B | $131.5B |
| Leavers (3) | $88.8B | $3.1B | $0.52B | $89.6B |
| Missing + leavers (4) | $114.8B | $4.1B | $0.56B | $116.3B |
2 Total = wealth tax + extra income tax − income tax lost (present value, 5 years at 3%). Whose choice the total is: footnote 1 above.
The yearly income tax loss has no end date in Table 5. The authors argue it should last about as long as the five payment years; the JR analysis (Jaros and Rauh; first version Rauh, Jaros, Kearney, Doran and Cosso) counts it forever; BSZ call treating the responses as permanent "the main flaw in the scoring analysis of Rauh et al." (PDF p.22, fn.29). The revenue itself moves with only two guesses: the avoidance rate, and whether anyone left California before 1 January 2026. See every input, by origin.
What this OPA does not estimate. Both analyses, and so this OPA, take the measure as written (full text in docs/initiative/): the 5% rate, the 1 January 2026 residency date, the 31 December 2026 valuation date and payment in five yearly installments, with the wealth tax counted at its face value, not discounted over the five years. Neither analysis estimates the day-to-day movement of the Forbes base (GGSS, the Galle, Gamage, Saez and Shanske expert report written in support of the measure, note a range of $87 billion to $107 billion between January and July 2026, p.4 fn.8). The BSZ analysis alone adds the income tax from assets sold to pay the tax; the JR analysis alone weights the revenue by the chance the Act survives in court. Nothing is added to either here.
What reproduces
| Published object | Result |
|---|---|
| Table 5, estimating the one-time tax (PDF p.39) | All 28 cells match the workbook's cached values. 26 round to the digit the paper prints; the other 2, the income tax loss in rows 2 and 3, are printed as $0.19B and $0.51B where the workbook gives $0.20B and $0.52B |
| Tables 1 to 4 and A1, Figures 1 to 7, 9 and A2 to A4 | Every formula cell the pipeline re-derives matches the workbook's cached value within the tolerances the README lists (1e-4 for Table 5; 1e-3 to 1e-2 for the formula sheets, where the workbook rounds to cents). Figures are checked for structure and anchor values |
| The authors' workbook | Four rows of the billionaire list pasted twice (rows 1342 to 1345 repeat 1338 to 1341), giving 244 billionaires instead of 240; the pipeline drops the repeat; the workbook's own aggregate sheet and the paper already count 240, so no published number is affected |
| Not reproduced | The paper's Figure 8 and Appendix Figure A1 (wealth relative to AGI); the raw data behind the workbook (Forbes, tax statistics, SEC filings), which is taken as given |
Every finding is in the report. Test counts, scripts and the source manifest are on the materials page.
How AI was used in this exercise, and what has been verified
The numbers on this page reproduce and are tested; what is still being completed is the author's own review of each part, recorded in the last column below, and the credit interview.
This work was a collaboration between the author and Claude Code (Opus and Sonnet models) across many sessions, not an AI working alone. The table records who led the work on each public object of the BSZ analysis, using the CRediT contributor roles. The author gave these answers in a questionnaire on 2026-10-01; they were not inferred from commit history. The author answered the roles once and applied the same answers to every object on all three pages, and answered the verification question object by object. The table groups the 14 roles into three: ideas and direction (conceptualization, methodology, supervision, project administration), doing the work (data curation, formal analysis, investigation, software, validation, visualization) and writing (original draft, review and editing). Funding and resources do not apply. Each square in a cell is one role, coloured by who led it (key below the table). The last column is not part of CRediT. It records how closely the author has checked the object. The role-by-role answers are in CREDIT.md.
| Object | Ideas and direction | Doing the work | Writing | Human verification |
|---|---|---|---|---|
| Explorer Open Output | ||||
| Report Open Analysis | ||||
| Slides Open Analysis | ||||
| Repository Open Materials | ||||
| Overview page this page |
Human verification uses three levels: not reviewed, lightly reviewed (checked, but the author cannot yet explain it clearly) and reviewed (the author can explain it to others). The automated test suites are mechanical checks, not an outside review. No other person has verified this work, and the original authors have not reviewed it.