Part of an independent reproduction of Korinek et al. (2026): Open Output (here) · Open Analysis: Report and Slides · Open Materials · Overview
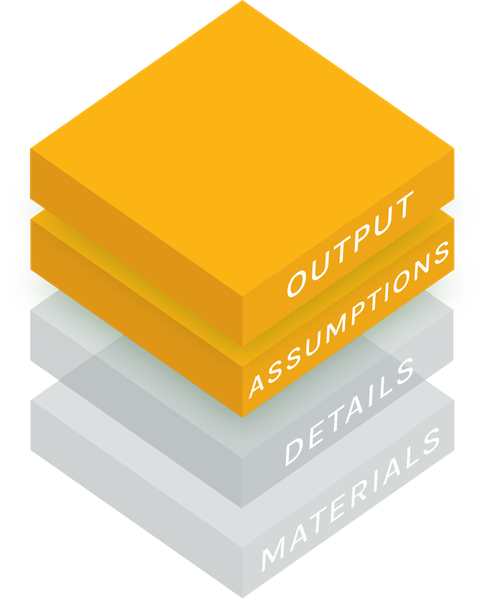
An independent reproduction of Economic Scenarios for Transformative AI, following the Open Policy Analysis framework: this page is its open output.
Korinek, Jones, Sacher, Cotter and McCrory run their transformative-AI model at three settings and label them modest, substantial and extreme. But the model takes seven inputs, and those three scenarios move all seven in lockstep. Set them independently here: every one of the 4374 combinations is precomputed, so the 2030 outcomes appear as you click. Reinstatement is carried on a finer grid than the paper's, including values at and above one.
Two things to hold onto while reading the numbers. Every figure on this page is a gap against the same US economy without AI, which grows at its ordinary 2 percent a year: "+8.3 percent" means 8.3 percent above that path, never a forecast of growth or of the level. And the model splits the workforce in two: the AI-sensitive occupations, whose tasks AI is assumed to touch, and all other occupations. (The paper calls the first group "cognitive"; this page, the deck and the landing page do not, because the label implies the electrician and the home health aide are not thinking. The written report keeps the paper's word, since it follows the paper line by line.)
aiscen) that reproduces all 169 cells of the paper's
Tables 3, 5 and 6 within the test suite's tolerance, 153 of them to the printed digit; the
sixteen that round to a different last digit are listed cell by cell in the repository README.
The three named scenarios sit at the corners of this grid. One convention to note: the gain
a follows the paper's own explorer. At 0.30 it is held flat; at 0.45 and 0.80 it
rises in a straight line from the substantial scenario's mid-2026 anchor (0.35) to the dial's
2030 value, so each level lands exactly on its label. The paper keeps the extreme scenario's own
anchor (0.45), so the extreme corner lands within 0.03 points of this reproduction's own run of
that scenario rather than exactly on it; the modest corner matches its run. Even
the substantial corner, which shares the grid's 0.35 anchor, misses slightly: Table 1's literal
slope for that scenario, 0.028 per year, only reaches a 2030 gain of 0.448 (which Table 1 itself
rounds to "0.45" in prose), while the grid solves backward from the axis label to land on 0.45
exactly, so its GDP gap reads 8.30 against 8.28 for the scenario's own run, and its average wage 2.16
against 2.14, which rounds to 2.2 rather than the paper's 2.1. GDP growth is
the exception, because it is a change over the preceding twelve months rather than a 2030
level and so depends on the whole path: at the extreme corner it reads 15.67 here against
that scenario's own 15.46 and the paper's 15.4. Reinstatement runs over
six values here, three of them (0.75, 1.00 and 1.25) outside the range the paper uses; at the
two of those at or above 1, the labor share rises above its 60 percent starting point,
territory the paper's own scenarios never enter (at 0.75 it can go either way: it ends above
60 percent in 162 of that level's 729 cells).
| Outcome in 2030 | This setting | Modest | Substantial | Extreme |
|---|